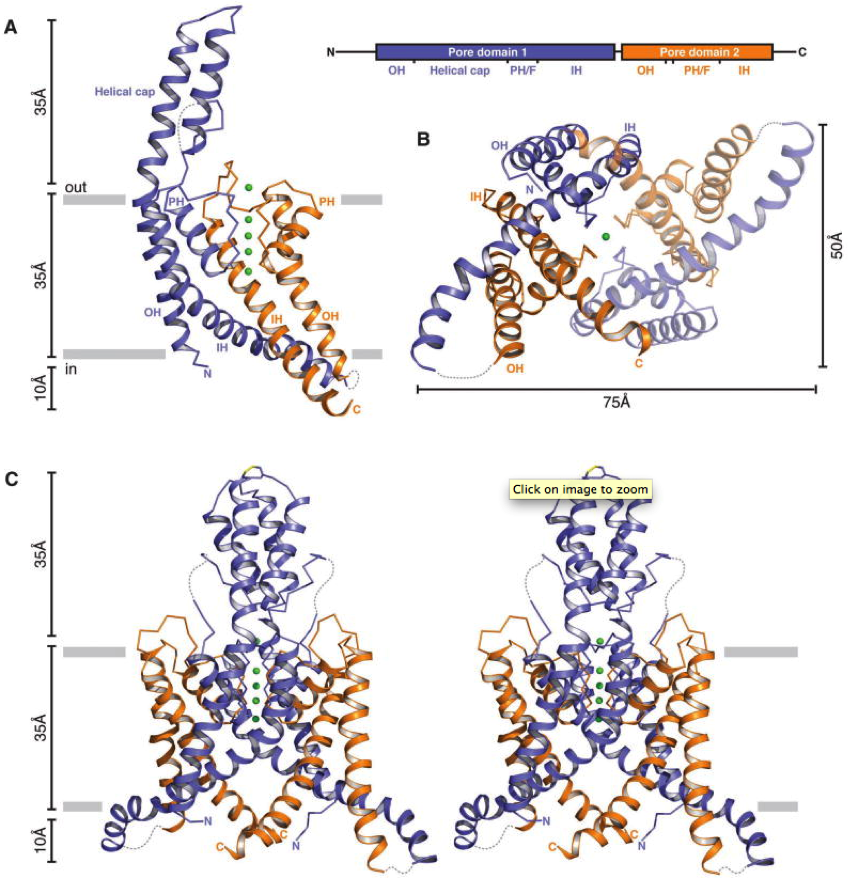
K2P TRAAK Crystal Structures

(A) Ribbon representation of a single TRAAK protomer viewed from the membrane plane with the extracellular solution above (left). Approximate positions of the lipid bilayer boundaries are indicated as gray bars. Pore domain 1 is colored blue, pore domain 2 is colored orange, and potassium ions are shown as green spheres. Illustration of TRAAK protomer organization (right). Approximate boundaries of structural features are indicated in the illustration and labeled in the structure (N and C terminus, outer helix (OH), helical cap, pore helix (PH), selectivity filter (F), and inner helix (IH)). (B) A view of the TRAAK channel from the cytoplasmic solution. The protomer shown in (A) is rotated 90 both into the page and clockwise and the second protomer is half transparent. (C) Stereo view of TRAAK viewed from the membrane plane with the protomer shown in (A) rotated 90 . The disulfide bond bridging the apex of the helical cap is shown in stick representation with the cysteine sulfur colored yellow. Note that part of the cytoplasmic extension of protomer B (residues 180–187) is not present in the final TRAAK model due to weak electron density features. Here it is modeled from a superposition of the well-defined region in protomer A for visual clarity. Loops not modeled in the structure due to lack of interpretable electron density are drawn as dashed gray lines.
Brohawn, S.G., del Marmol, J., MacKinnon, R. (2012). Crystal structure of the human K2P TRAAK, a lipid- and mechano-sensitive K+ ion channel. Science, 335(6067), 436-441. doi:10.1126/science.1213808
