GIRK2-Beta-Gamma Crystal Structure
GIRK2-βγ Crystal Structure

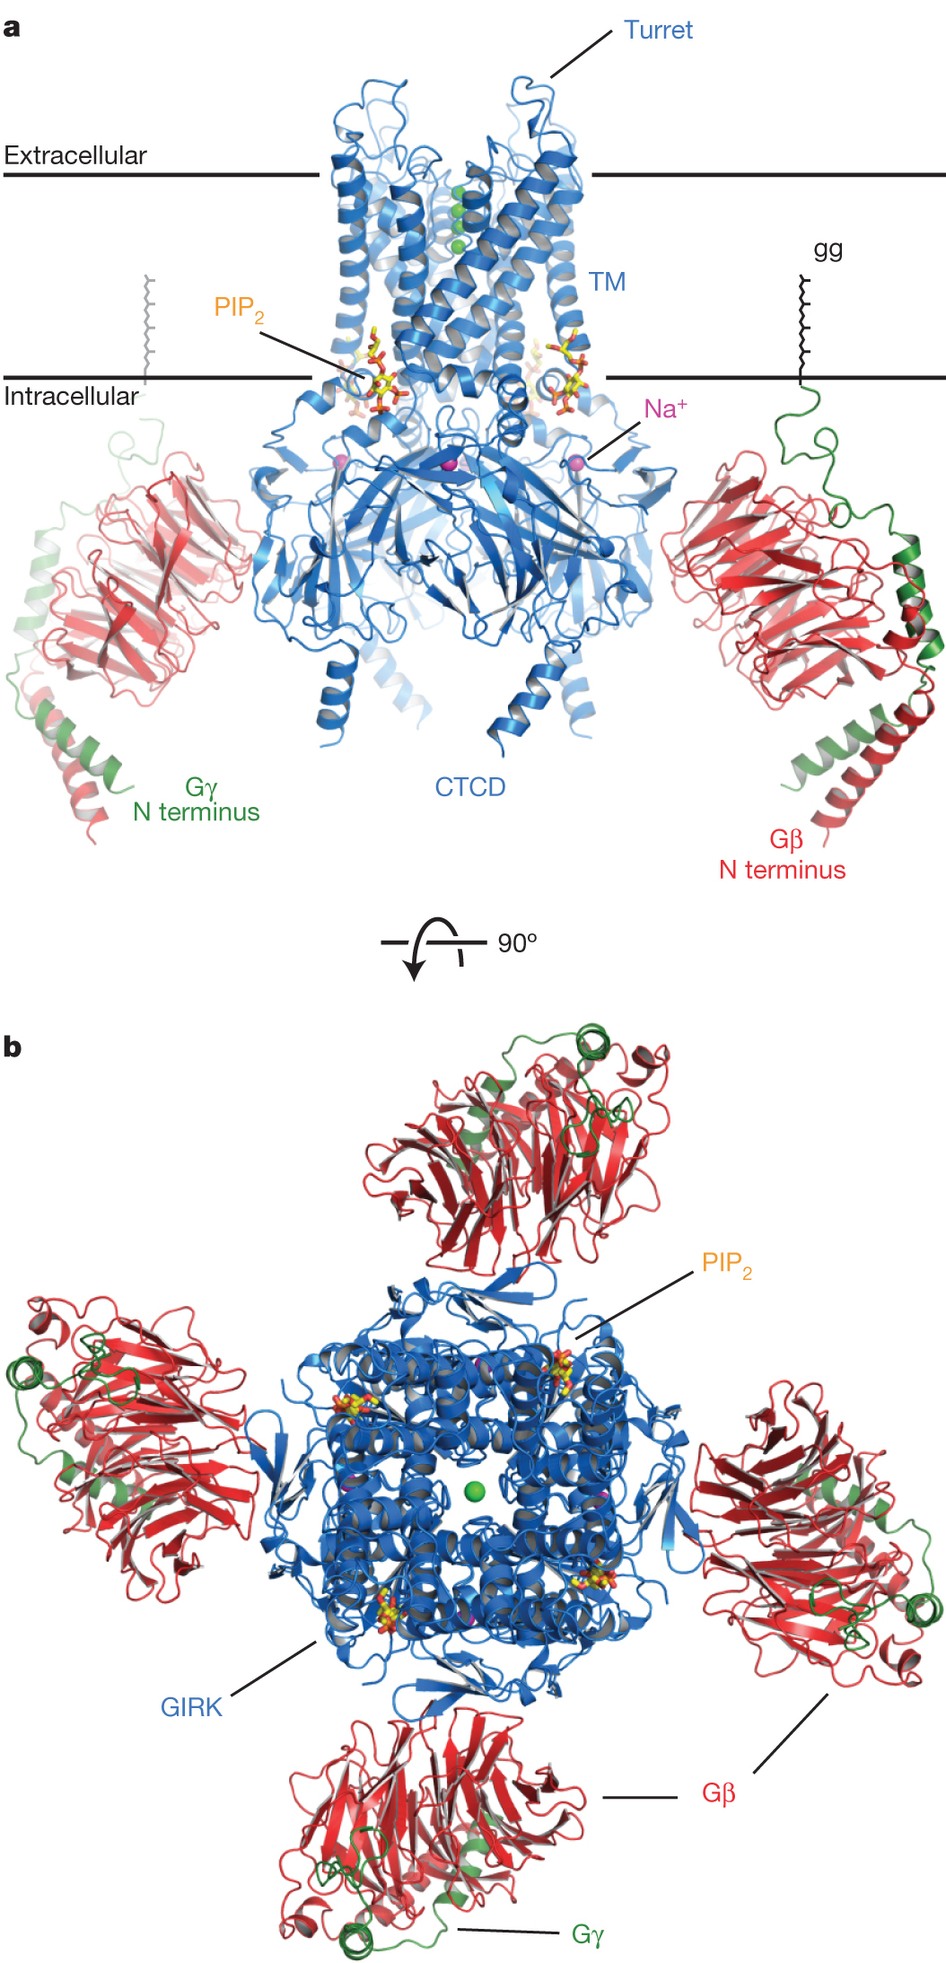
Overall structure of the GIRK–Gbc complex. a, A side view of the GIRK (blue), Gb (red) and Gc (green) complex. The front Gbc dimer was removed for clarity. The approximate extent of the phospholipid bilayer is shown by the black lines. The ‘gg’ label indicates the geranylgeranyl lipid modification at the C terminus of Gc. Bound Na1 ions are shown as purple spheres, the PIP2 molecules are shown as sticks and the K1 ions as green spheres. b, Top-down viewof the complex fromthe extracellular side of the cell.

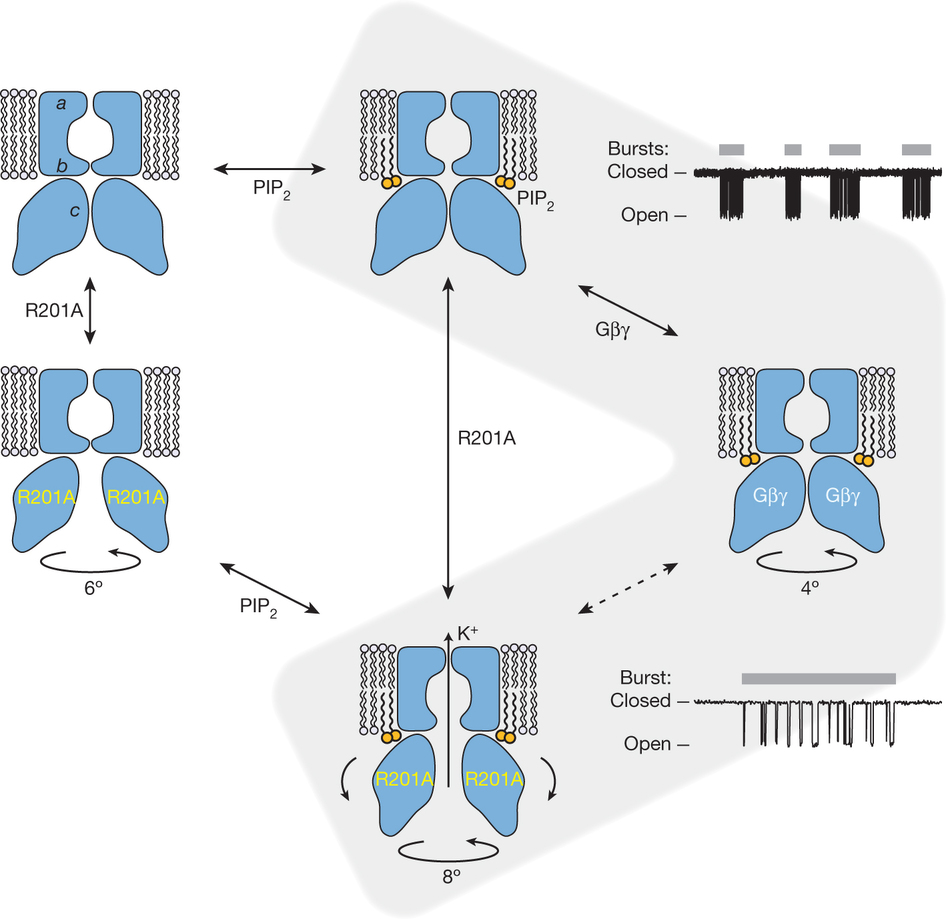
A model of gating regulation of GIRK channels. The blue shapes depict a GIRK channel with a selectivity filter (a) and two gates: the inner helix gate (b) and theG loop gate (c). The structures correspond to wild-type GIRK without PIP2 or Gbc (PDB: 3SYO), wild-typeGIRKwith PIP2 only (PDB:3SYA), GIRK(R201A) without PIP2 or Gbc (PDB: 3SYP), wild-type GIRK with PIP2 and Gbc (PDB: 4KFM), andGIRK(R210A) with PIP2 (PDB: 3SYQ). Circular arrows with degrees indicate CTCD rotation about the pore axis with respect to the TMD, relative to wild-type structures without Gbc. Curved arrows in GIRK(R201A) with PIP2 reflect the outward rocking of CTCD subunits observed in this structure. Idealized single-channel recordings are shown on the right (expanded time scale on the bottom) to illustrate our current hypothesis regarding the gating transitions that the channel undergoes. Inter-burst periods correspond to a channel with only PIP2 bound (top); bursts (grey bars) correspond to the channel with PIP2 and Gbc bound, which fluctuates rapidly (indicated by dashed arrows) between non-conducting (right) and conducting (bottom) conformations.
Whorton, M.R., MacKinnon, R. (2013). X-ray structure of the mammalian GIRK2-βγ G-protein complex. Nature, published online June 5. PubMED PMID: 23739333.
