CLC E. coli

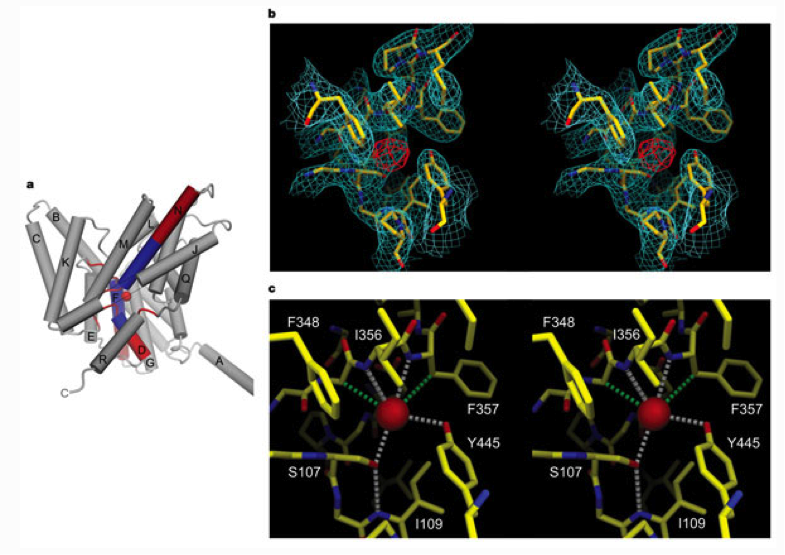
a, Helix dipoles (end charges) point towards the selectivity filter. The -helices are shown as cylinders with labels corresponding to Fig. 4a. The amino (positive, blue) and carboxy (negative, red) ends of -helices D, F and N are shown. The selectivity filter residues are shown as red cords surrounding a Cl- ion (red sphere). The view is from 20° below the membrane plane; the dimer interface is to the right, and the extracellular solution above. Part of -helix J has been removed for clarity (grey line). b, Stereo view of electron density in the selectivity filter. A 2Fo - Fc Cl- omit map (StClC P21 crystal form, 3.0 Å resolution, 1 contour, cyan) is superimposed on a stick model of residues selected within a 5 Å radius of the Cl- ion. An FBr - FCl difference Fourier map (StClC C2 crystal form, 4.5 Å resolution, 5 contour, red) is shown transformed to the corresponding position in the P21 unit cell. c, Stereo view of the Cl- ion-binding site. Distances (<3.6 Å) to the Cl- ion (red sphere) are shown for polar (white dashed lines) and hydrophobic (green dashed lines) contacts. A hydrogen bond between Ser 107 and the amide nitrogen of Ile 109 is shown (white dashed line).

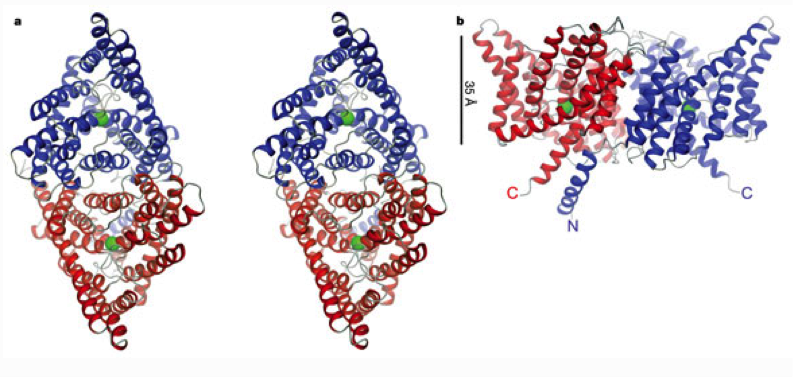
a, Stereo view of a ribbon representation of the StClC dimer from the extracellular side. The two subunits are blue and red. A Cl- ion in the selectivity filter is represented as a green sphere. b, View from within the membrane with the extracellular solution above. The channel is rotated by 90° about the x- and y-axes relative to a. The black line (35 Å) indicates the approximate thickness of the membrane.
Dutzler, R., Campbell, E.B., Cadene, M., Chait, B.T., MacKinnon, R. (2002). Nature, 415, 287-294. doi: 10.1038/415287a
