CLC Crystal Structure

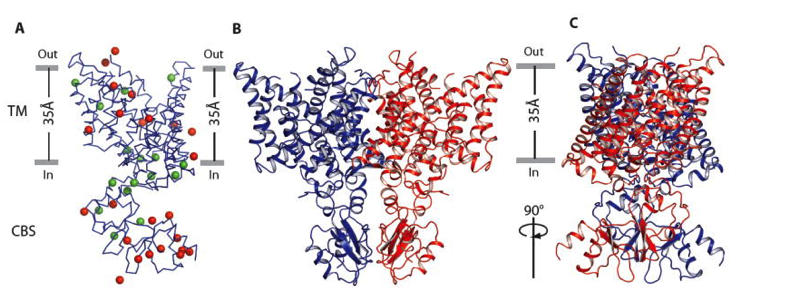
(A) Selenium sites identified by SAD. Wire representation of a CmCLC monomer is shown in blue. The selenium sites of the selenomethionine-labeled wild type protein are shown as green spheres and those corresponding to “marker mutants” are colored in red. (B) and (C) Ribbon representation of a CmCLC dimer from the side of the membrane with extracellular solution above. Two subunits are colored in blue and red, respectively.
Feng, L., Campbell, E.B., Hsiung, Y., MacKinnon, R. (2010). Structure of a eukaryotic CLC transporter defines an intermediate state in the transport cycle. Science, 330(6004), 635-641. doi: 10.1126/science.1195230

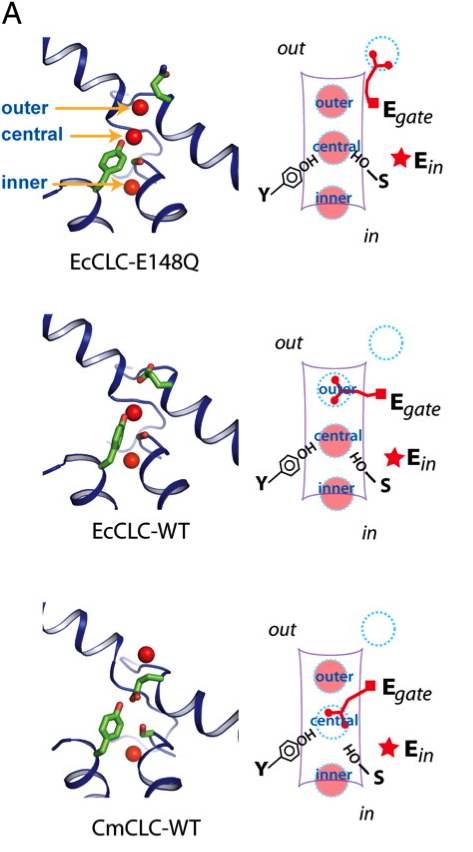
Fig. 1. Kinetic model of the transport cycle. (A) Three known conformations in the transport cycle. Left show close-up views of the ion-transport pathway of the E148Q mutant of EcCLC (Top), WT EcCLC (Middle), and WT CmCLC (Bottom), respectively. Selected residues are shown as sticks and Cl- as red spheres. Right panels show schematics of different ion transport pathway conformations corresponding to structures shown on the left.
Feng, L., Campbell, E.B., MacKinnon, R. (2012). Molecular mechanism of proton transport in ClC Cl-/H+ exchange transporters. PNAS, 109(29), 11699-11704. doi:10.1073/pnas.1205764109.
