The Human Gene Connectome (HGC)
- The Human Gene Connectome Server (HGCS)
- Human gene-specific connectomes - download specific genes
- Human gene-specific connectomes - download all
- Programs
- The Gene Damage Index (GDI)
- GDI server
- The Mutation Significance Cutoff (MSC)
- MSC server
Introduction
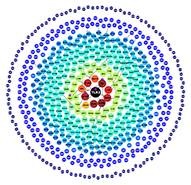
The HGC is the set of all biologically plausible routes, distances, and degrees of separation between all pairs of human genes. A gene-specific connectome contains the set of all available human genes sorted on the basis of their predicted biological proximity to the specific gene of interest. The HGC is a powerful approach for human genotype-phenotype high-throughput studies, for which it can be used to rank any list of genes within a gene-specific connectome for an experimentally validated core gene. See (1) below.
The human gene connectome server (HGCS) is an effective and easy-to-use interactive web server that enables researchers to prioritize any list of genes by their biological proximity to defined core genes (i.e. genes that are known to be associated with the phenotype), and to predict novel gene pathways.
Functional genomic alignment (FGA) is equivalent to traditional multiple sequence alignment (MSA), except that it clusters genes in trees on the basis of the functional biological distance between them predicted by HGC, rather than on the basis of molecular evolutionary genetic distance. This method is therefore more suitable for disease and phenotypic studies. See (2) below.
The "human gene-specific connectomes" folder contains a gene-specific connectome file for each human gene. Alternatively you can download all human gene-specific connectomes in one compressed file.
The "programs" folder contains the computer programs for ranking lists of genes within a gene-specific connectome, clustering and plotting the genes by the functional genomic alignment (FGA) approach and generating gene-specific connectomes (also see (3) below). All these aspects are described in more detail in the paper. The programs were developed and tested on Mac and Linux systems. The external software required for running these programs is open-source and free of charge.
Step-by-step instructions for the use of the programs
- Ranking a list of genes on the basis of their biological proximity to any list of core genes of interest:
- Ensure that the Python (2.X version) programming language is installed.
- Create a text file named candidate_genes.txt for the list of human gene names to be ranked, one below the other, as follows:
IKBKG
IFNGR2
STAT1 - Create a text file named core_genes.txt for the list of human core gene names to be ranked by, one below the other, as follows
TLR3
IFNG - Download HGC_ranking.py and the gene-specific connectomes of the core gene of interest (for example - TLR3.txt and IFNG.txt, or download all gene-specific connectomes at once) into a folder (created by you) named "All_connectomes", inside same folder of HGC_ranking.py and the gene lists text files.
- Open a terminal window and, assuming that the files are located in a directory called /Users/Johndoe/hgc and the gene list file name is gene_list.txt type the following lines:
cd /Users/Johndoe/hgc
python HGC_ranking.py - The output file in this case would contain the list of genes extracted from the gene-specific connectome, ranked by biological distance, which can be opened in Microsoft Excel.
- Clustering genes by their biological distance from each other (FGA) and tree plotting:
- Ensure that the R and Python programming languages and the Python Package NetworkX and the R package APE are installed.
- Create a text file called gene_list.txt for the list of human gene names to be clustered, as in (1).
- Download the files Nodes_binding_9.05.txt, Edges_binding_9.05.txt, HGC_matrix.py, and FGA_plot.R into the same folder as list.txt
- Open a terminal window and go to the folder containing the files, as in (1).
- Type:
python HGC_matrix.py - Type:
Rscript FGA_plot.R - The biological distances clustering plot is named FGA_tree.pdf
- If the fonts and/or page size are not appropriate then open the file FGA_plot.R in a text editor. Change "width" and "height" to control page size, and change "cex" to control font size. Alternatively refer to the R "ape" manual: http://cran.r-project.org/web/packages/ape/index.html. Save the file and rerun.
Citation and usage
When using the Human Gene Connectome Server (HGCS), a gene-specific connectome or any of the programs provided, please cite the following papers:
Itan Y, Mazel M, Mazel B, Abhyankar A, Nitschke P, Quintana-Murci L, Boisson-Dupuis S, Boisson B, Abel L, Zhang SY, Casanova JL (2014). HGCS: an online tool for prioritizing disease-causing gene variants by biological distance. BMC Genomics.
Please refer to this paper for additional information about the human gene connectome concept and its applications in morbid allele discovery and genotype-phenotype studies.
The human gene-specific connectomes data and computer programs are freely available to non-commercial users.
Contact
In case of problems or questions, please e-mail Yuval Itan at: yitan@rockefeller.edu

